The Art (and Peril) of Modeling Catastrophic Cyber Risk


A new report from Guy Carpenter on the state of the cyber insurance industry provides the most recent estimate of global cyber premium at $14 billion. The report also quantifies the industry’s cyber aggregation risk potential, modeling the global loss for a 1-in-200 year event between $15.6 and $33.4 billion.
While different types of approaches have been employed to quantify catastrophic cyber risk, a judicious use of catastrophe models remains one of the most credible ways to determine useful industry loss estimates. This report presents a transparent multi-model analysis applied to the current global market.
At Coalition, we’ve made significant investments in our analytics capabilities, models, and tools around cyber risk aggregation and enterprise risk management. In this blog post, we’ll dive deeper into catastrophe models, add context to the Guy Carpenter-modeled industry losses, and explain our unique approach to cyber risk aggregation.
Approximating a global portfolio of cyber policies
To make catastrophe models workable when estimating potential global insurance industry losses, cyber risk modelers are faced with two options to represent the part of the market beyond their purview:
Run a simulation on a portfolio of policies specifically constructed to approximate the target cyber market (ex ante).
Run a simulation on a representative portfolio of policies and scale up the results to be in line with the target market (ex post).
In Coalition’s recent report, Active Cyber Risk Modeling: A modern approach to cyber risk aggregation, we pursued the second option for its simplicity to quickly put simulated numbers in perspective and because our effort was ultimately on economic losses, rather than insured losses. Guy Carpenter, one of the world’s leading reinsurance brokers, went the other route, taking a more robust approach to estimate insured losses, and created a synthetic portfolio approximating the current global cyber insurance market. Although industry participants don’t have access to a comprehensive repository of all the cyber policies with perfect details on the underlying risks, reinsurance brokers typically sit on a lot of relevant exposure data.
Guy Carpenter’s synthetic portfolio is based on their proprietary Cyber Data Lake: 1.8 million cyber policies with detailed terms and conditions collectively amounting to more than $6 billion in gross written premium. To get to an industry-wide estimate of cyber accumulation risk, they built a set of portfolios to "model geographical segments of the industry and extrapolate up to represent the global premium" of $14 billion. In a joint study with CyberCube Analytics in 2019, they resorted to a similar approach to create a synthetic portfolio of all U.S. cyber insurance policies (previously estimated at $2.6 billion) based on the revenue bands of insureds.
The synthetic portfolio approach works well with perils where the exposures tend to be driven by location, industry, or revenue bands. However, when it comes to cyber, accumulation happens because insureds have shared aggregation technologies and vendors — this is the core driver for tail risk.
There may be a future opportunity to build a more realistic synthetic industry portfolio based on actual technology and vendor detections. This is one of the reasons why Coalition’s Active Cyber Risk Model starts from the data we continuously collect on our policyholders. There’s no substitute for collecting actual cyber exposure data and making sense of it. By using inferior exposure proxies, like geography or revenue bands, simulated losses may be distorted (or even inflated) to a certain extent.
Tuning vendor models to simulate industry losses
The next step is generating cyber catastrophe loss estimates. Guy Carpenter used three market-leading cyber risk aggregation vendor models on the synthetic global portfolio of cyber policies: CyberCube Analytics v4, Guidewire Cyence M5, and Moody’s RMS v6.
It’s worth noting that the main purpose of vendor catastrophe models is to help carriers and reinsurers quantify their own exposure to specific perils. At their core, cyber risk aggregation models remain very close to their natural catastrophe relative. They allow actuaries and modelers to quantify their book of business exposure to a specific peril — on average or for a target return period, for example — based on the severity, frequency, and exposure components of a set of catastrophe scenarios. This helps with pricing, reinsurance, and exposure management decisions.
There’s no substitute for collecting actual cyber exposure data and making sense of it. By using inferior exposure proxies, like geography or revenue bands, simulated losses may be distorted (or even inflated) to a certain extent.
Cyber catastrophe vendor models are a more recent addition. Although they’ve matured since their introduction less than a decade ago, they remain quite different from more established catastrophe models: they still have very different scenarios, parameters, approaches, and ways to enrich or augment the portfolio data.
As a result, Guy Carpenter’s effort to run a multimodel analysis of cyber accumulation risk is no small feat. The report describes the reinsurance broker’s efforts to make the vendor models more comparable:
Each vendor’s scenarios were regrouped in three major event types: “Ransomware/Malware,” “Data Theft,” and “Cloud.”
Policy coverage was harmonized across the different vendors’ cost component categories.
Market exclusions were mapped against the vendors’ scenarios.
While this helps put the vendor models on a more equal footing, some problems remain:
The range of modeled output (e.g., close to $19 billion for the 1-in-50 year loss, corresponding to a 126% relative range) highlights that sophisticated vendor models remain fundamentally different despite the reinsurance broker’s efforts to harmonize simulation parameters.
Model outputs remain highly sensitive to input parameters.
A recent Gallagher Re report presents anonymized results of sensitivity tests on five major cyber models, in which the output (average annual loss or 1-in-200 year loss) of some models can vary between -55% and +35% when the input is altered (e.g., missing insureds names or unknown industry for an insured).
The results point to a lack of shared understanding of what realistic cyber tail events look like.
Putting simulated industry losses in perspective
To sense-check Guy Carpenter’s aggregate cyber risk numbers, we turned the simulated numbers into catastrophe loss ratios by dividing them by the estimated premium.
The line chart below shows the global portfolio catastrophic loss ratios for the three different vendor models. While the curves show that the loss ratios increase for higher return periods, as one would expect, it’s surprising that the range of model results is similar (if not a bit higher) for the 1-in-50 year loss compared to the 1-in-200 year loss. This appears to illustrate some of the core differences between the models that are hard to iron out for this type of comparative analysis.
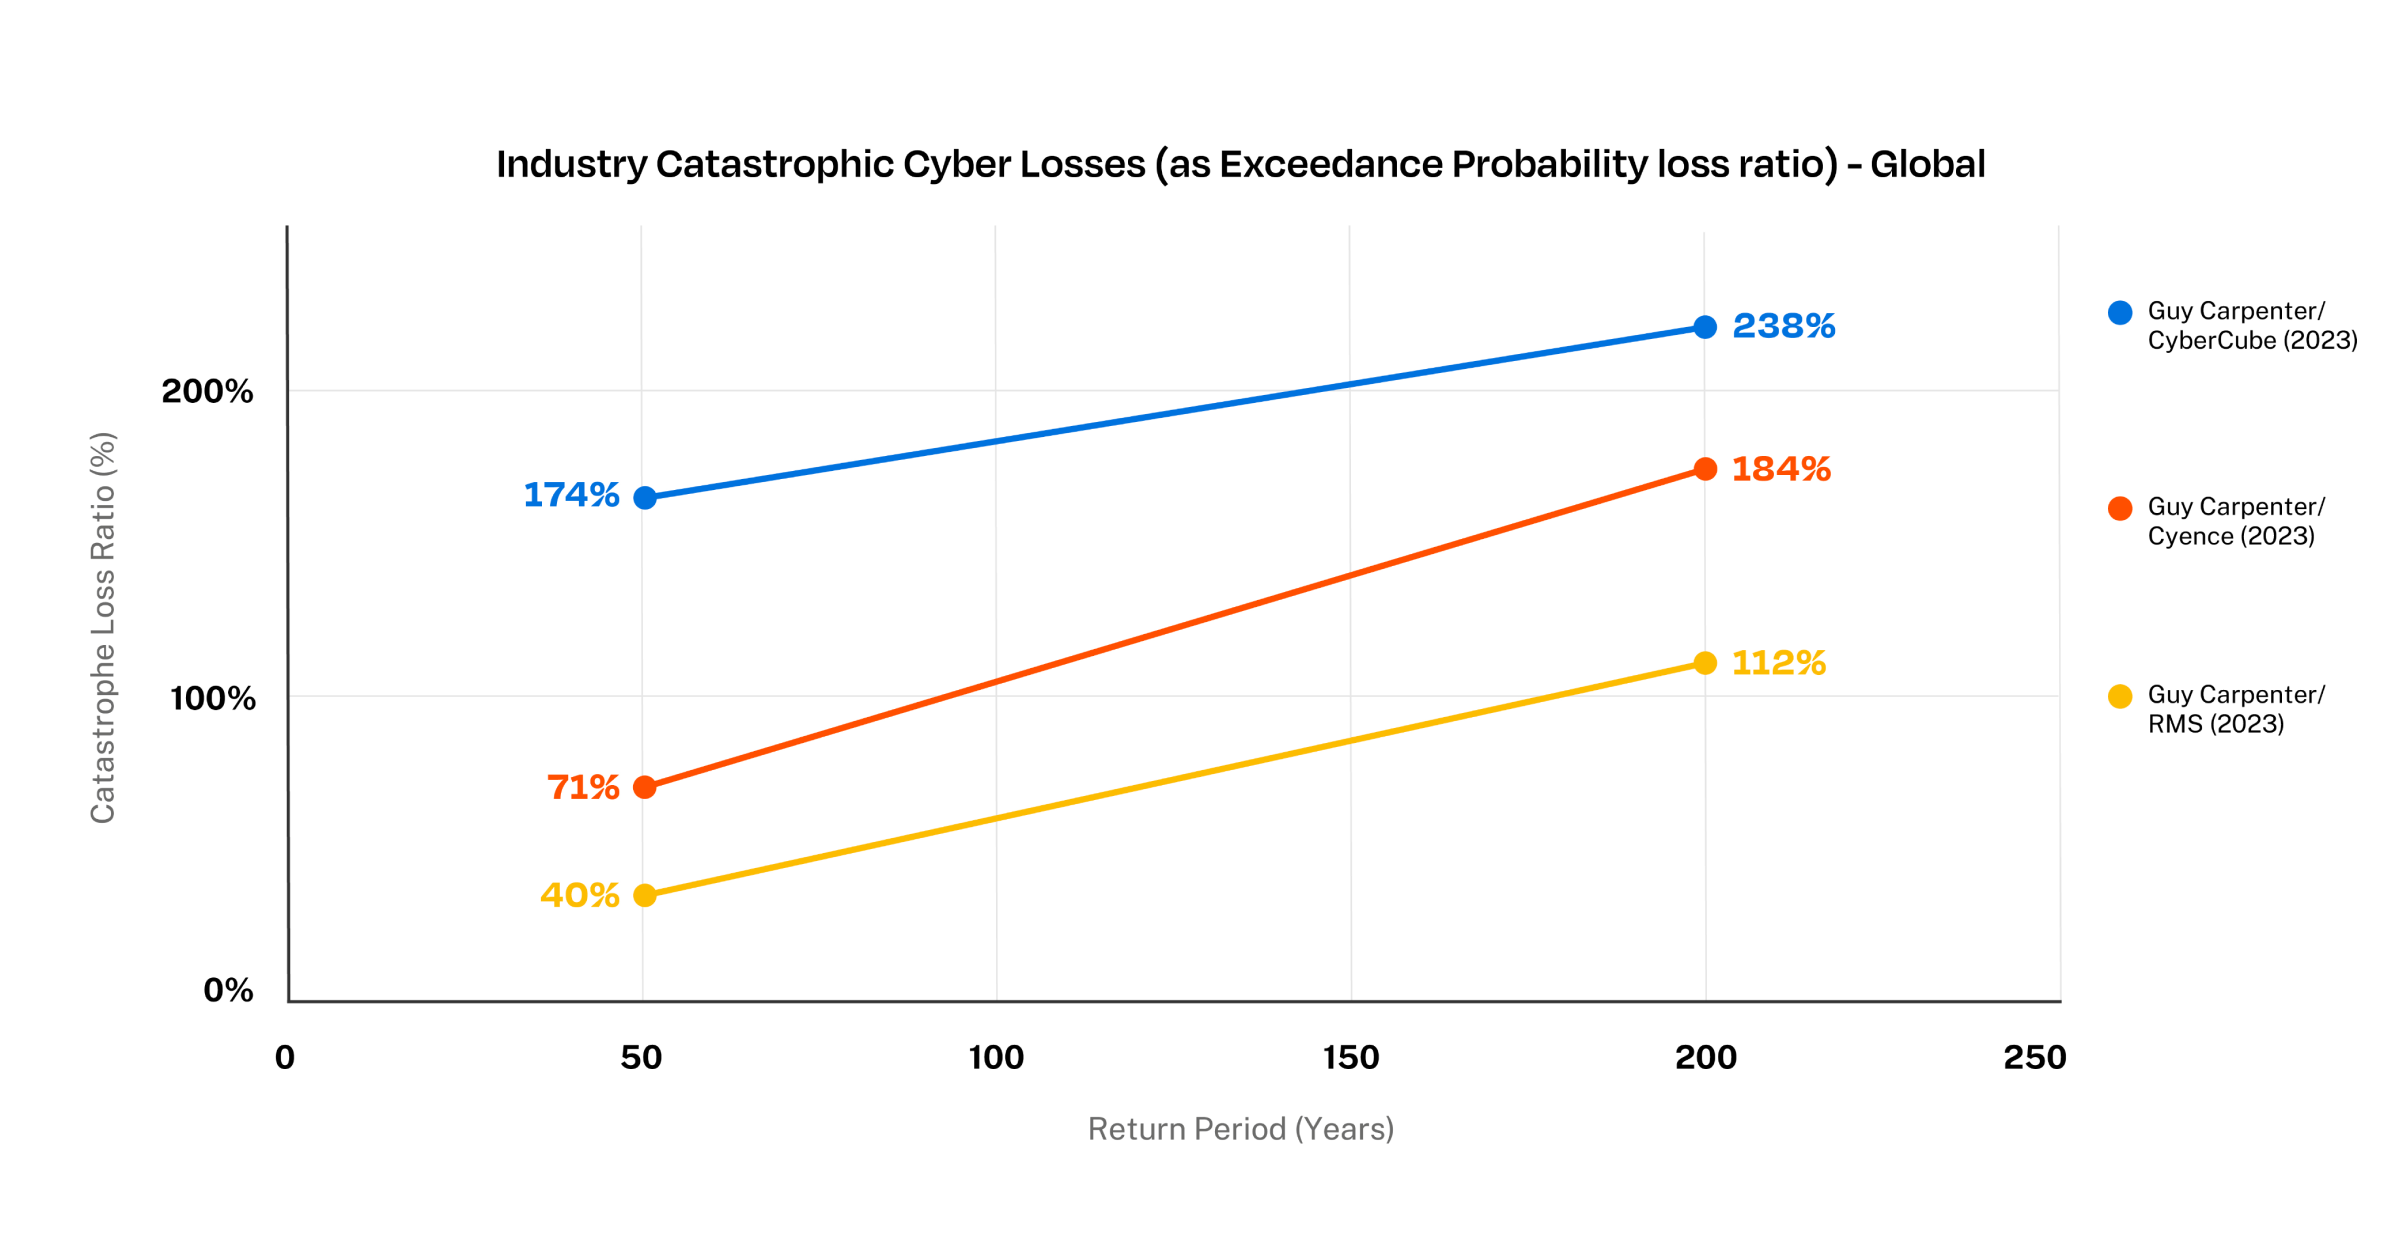
Global Cyber Modeled Catastrophic Loss Ratio for different Return Periods (2023 study)
Guy Carpenter’s report also dives into the top events and cost components behind these estimates. “Ransomware/Malware” events are the main loss driver for the three models used. Interestingly, they point to some fundamental differences between the models, such as how much “Data Theft” events contribute to losses and what percentage of losses stem from business interruption or contingent business interruption.
For the U.S. part of the portfolio, we used the results from the joint 2019 study from Guy Carpenter and CyberCube. Despite a few differences between the analyses, the line chart below shows that the loss ratios stemming from catastrophic events are trending downward between those two modeling efforts. It remains unclear to what extent this shift of the catastrophic loss ratio curves reflect a change in market fundamentals over the last four years versus a change in the models themselves.
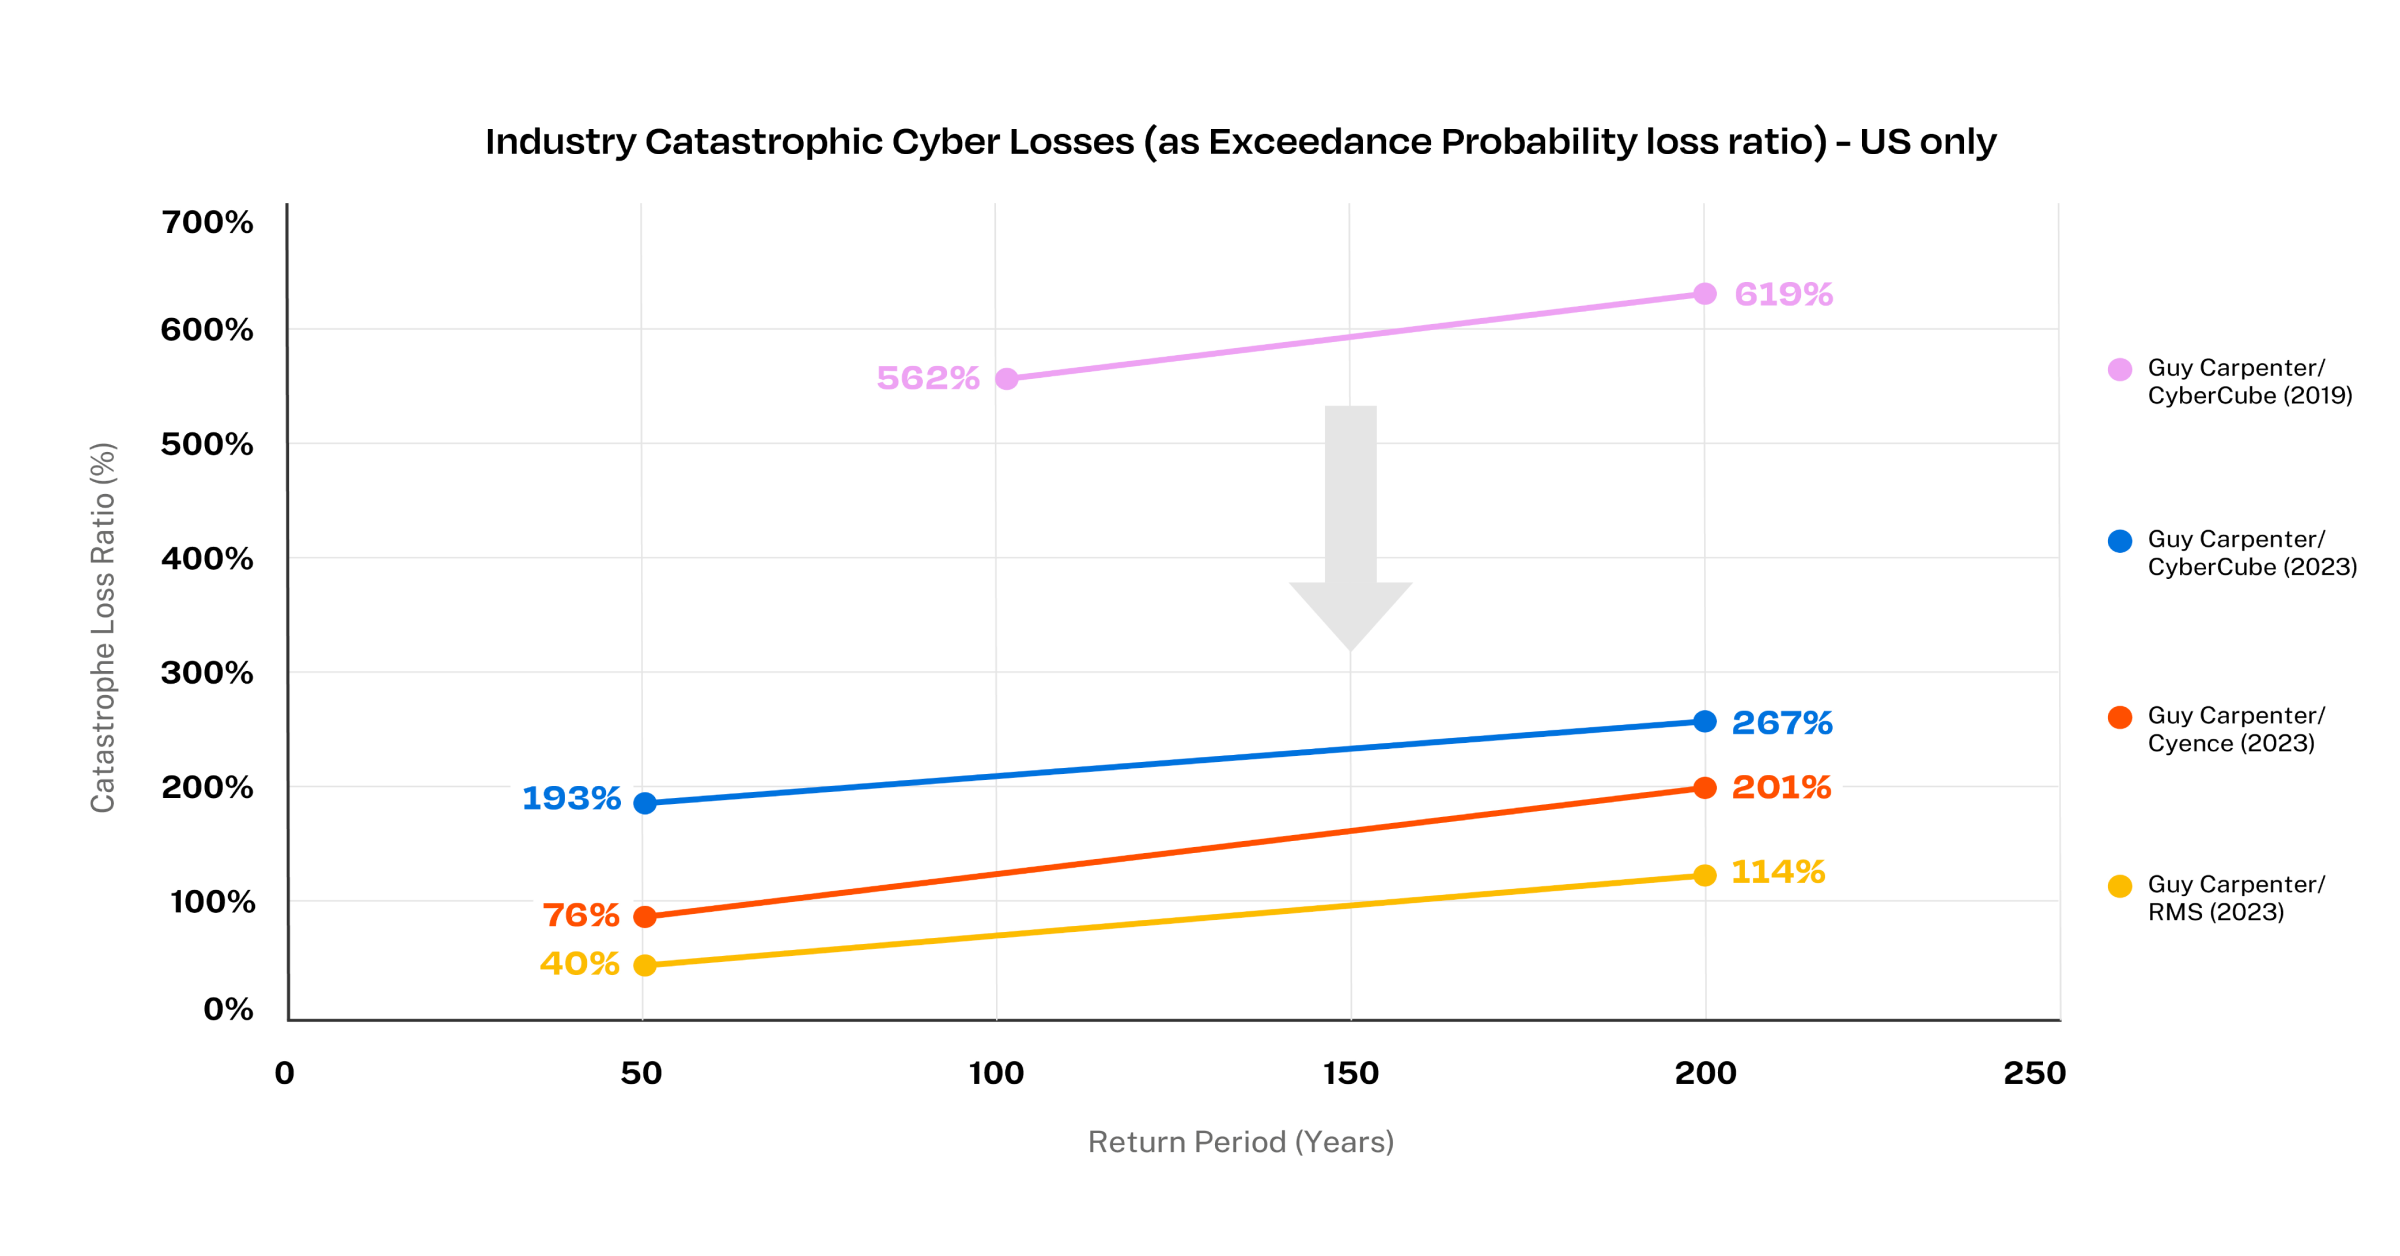
U.S. Cyber Modeled Catastrophic Loss Ratio for different Return Periods (2019 vs. 2023 studies)
On the one hand, it’s reassuring that the three leading models are getting closer to a more plausible loss ratio (while still exhibiting marked differences between them, which is a positive). On the other hand, it’ll always be difficult to see if those numbers pass our sniff test, as we’ve yet to experience a real cyber catastrophe event. Even NotPetya, the single largest “cyber” event to date, impacted a very limited number of organizations, and insured losses stemmed from property insurance policies with very high limits rather than cyber policies.
Toward a different cyber risk modeling approach
Guy Carpenter’s transparency efforts are admirable, as the report illustrates some of the modeling challenges experienced by market participants. Beyond the industry estimates, those numbers matter greatly as modeled losses have started to make their way into capital models and transactions (both traditional reinsurance and more innovative ILS). Many industry participants have been drawing parallels with natural catastrophe models' growing pains, but we can probably skip a few episodes (e.g., blended or average / range of model outputs) as cyber remains quite different.
As market participants, we don’t need to share the same view of risk. Coalition remains confident that cyber is the most knowable peril and that data remains king for cyber risk quantification. Our ground-up model leverages our extensive proprietary digital data and expertise. As a result, we are able to capture all the nuances (both technical and financial) that help generate a fully data-driven and informed set of credible loss numbers.
Coalition’s Active Cyber Risk Model helps us and our partners fine-tune our exposure management efforts across our programs, price even better, build strong foundations for enterprise risk management, and unlock better controls and opportunities for active cyber insurance. Click here to download the full report.
Related blog posts

Blog
5 Essential Insights From Our 2026 Cyber Claims Report
Discover how Active Insurance is helping businesses overcome the Cyber Protection Paradox with insights from Coalition’s 2026 Cyber Claims Report.


Blog
Introducing Coalition for Private Equity
Move beyond transactional placements and empower your PE sponsor clients with a strategic framework to protect their portfolio value with Coalition for Private Equity.


Blog
Bridging the Cyber Insurance Gap Between Brokers and SMEs
Coalition UK research reveals a gap between specialist cyber insurance take-up by SME decision makers and broker impact on outcomes.